Android Debugging And Running Application
Debugging is the process of identifying and correcting bugs in your code or unexpected behaviour. All code has bugs, including incorrect behavior, memory or network resources consuming behavior, freezing or crashing of the actual App.Bugs can result for many reasons:
- Errors in your design or implementation.
- Android framework limitations (or bugs).
- Missing requirements or assumptions for how the app should work.
- Device limitations (or bugs)
Use Android Studio debugging, testing and profiling to help reproduce, detect and solve all these problems. These include:
- The Android monitor (logcat)
- The Android Studio debugger
- Testing frameworks such as JUnit or Espresso
- Dalvik Debug Monitor Server (DDMS), to track resource usage
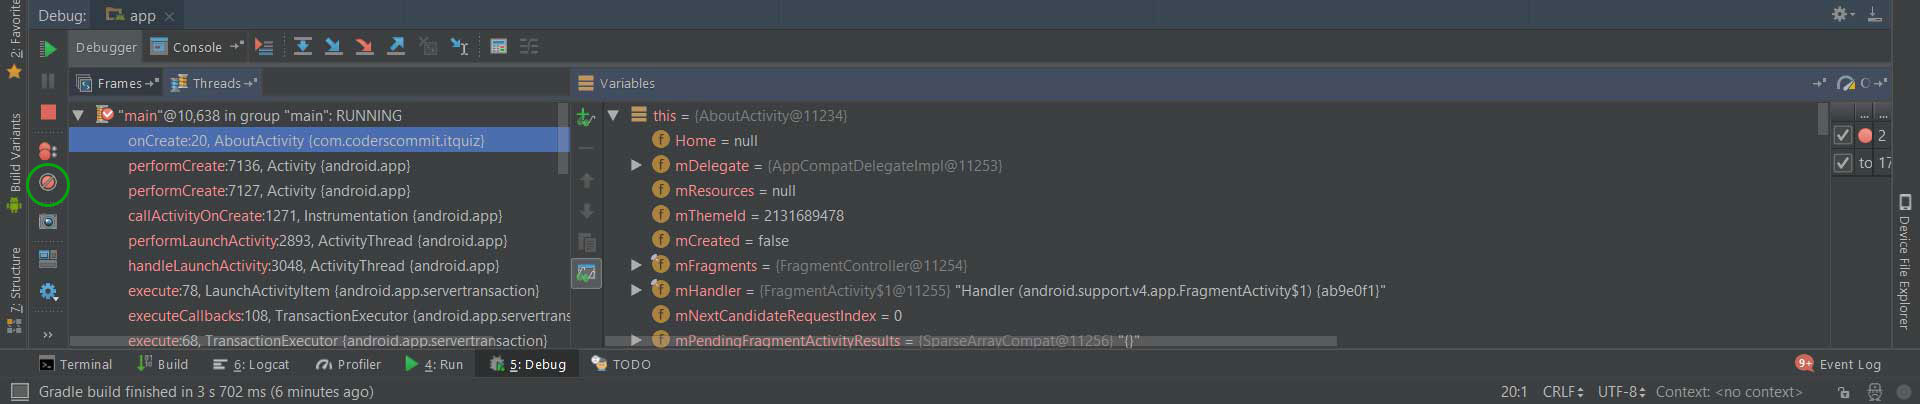
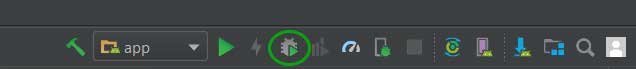
Run your app in debug mode
To start debugging, click Debug in the toolbar. Android Studio creates an APK, signs it to your chosen device using a debug key, and then runs it, opening the debug window.
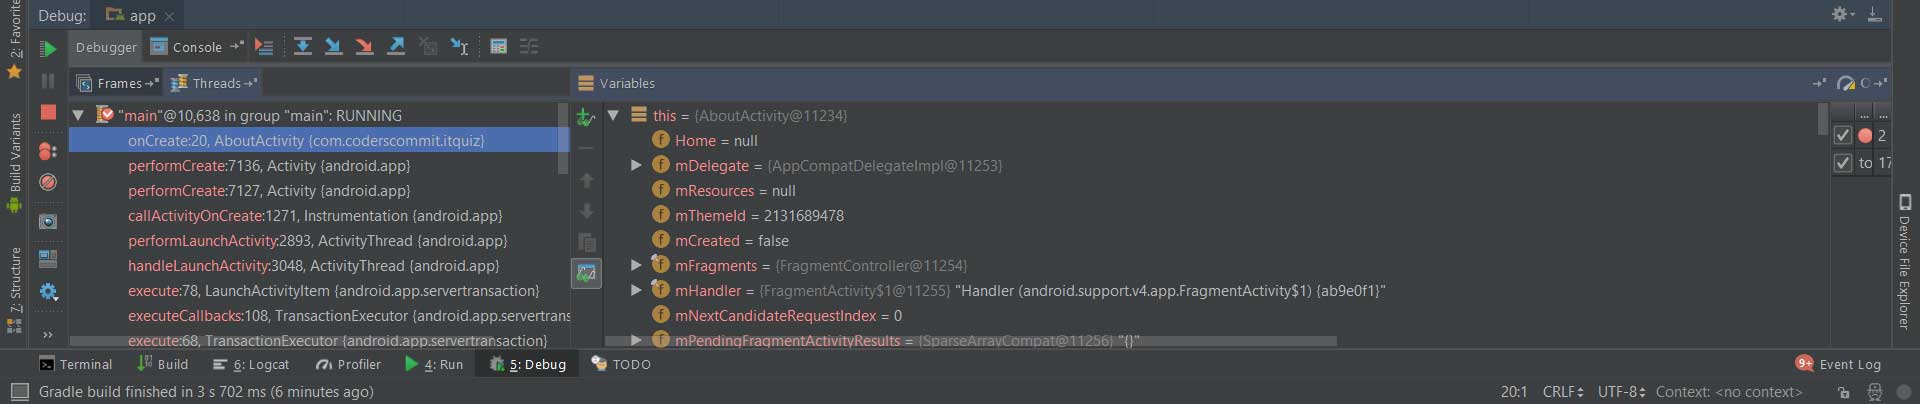
Debug a running app
Start debugging this app with these steps when your app is already running on the device or emulator.
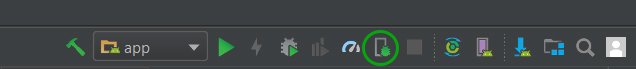
- Select Run > Attach debugger to Local process or click the Attach icon in the toolbar.
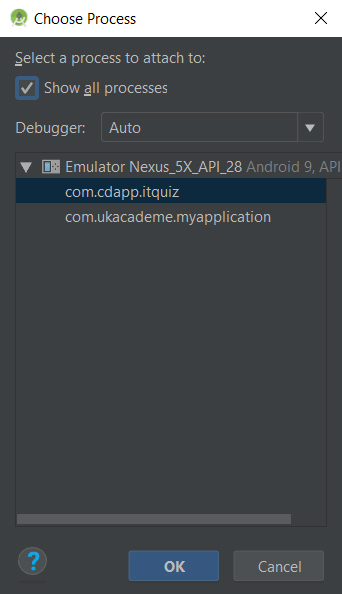
- In the Choose Process dialog, select the process to which you want to attach the debugger.
By default, the debugger shows your device and application process and any connected hardware or virtual devices on your computer for the current project. Select Show all processes on all devices to display all processes.
- Click OK. The Debug window appears as before.
Resume or Stop Debugging
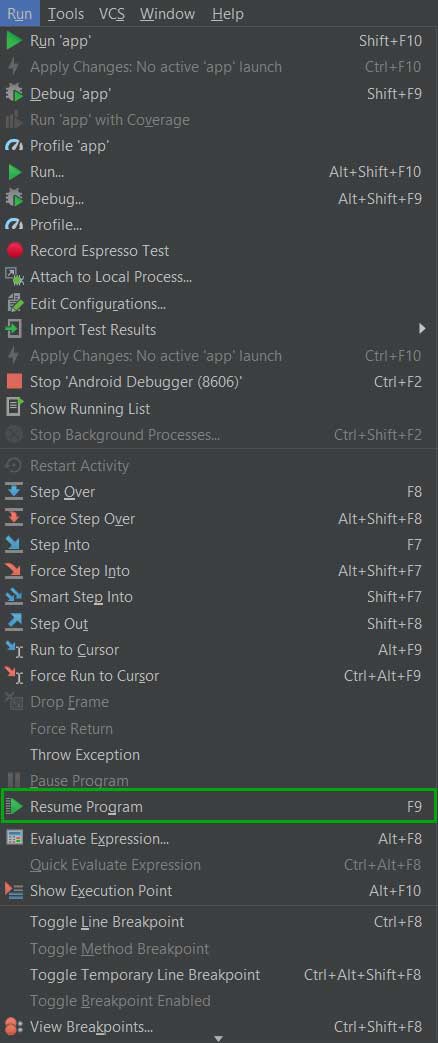
To resume executing an app after debugging it, select Run > Resume Program or click the Resume icon.
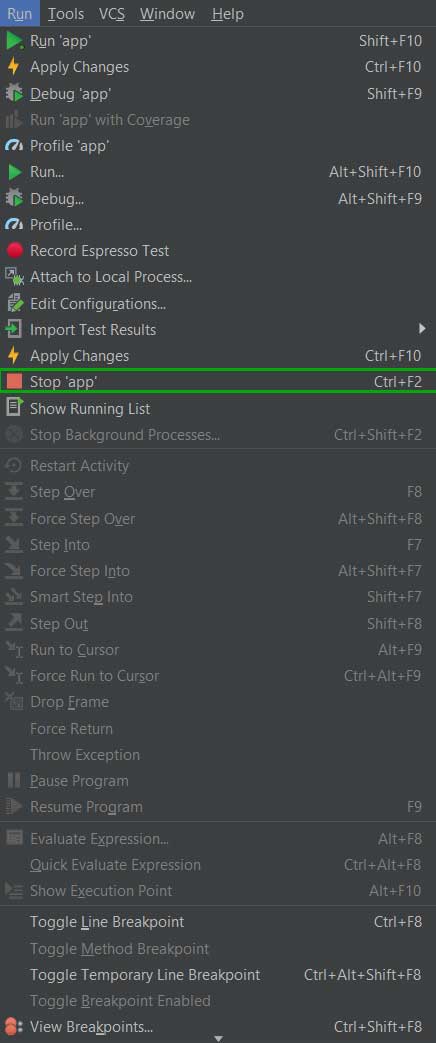
To stop debugging your app, select Run > Stop or click the Stop Icon in the toolbar.
Using Breakpoints
A breakpoint is a location in your code where you want to break down the normal application to do other activities, such as checking variables or assessing expressions, or line by line executing your code to determine why runtime errors are caused.
Add breakpoints
To add a breakpoint to a line in your code, use these steps:
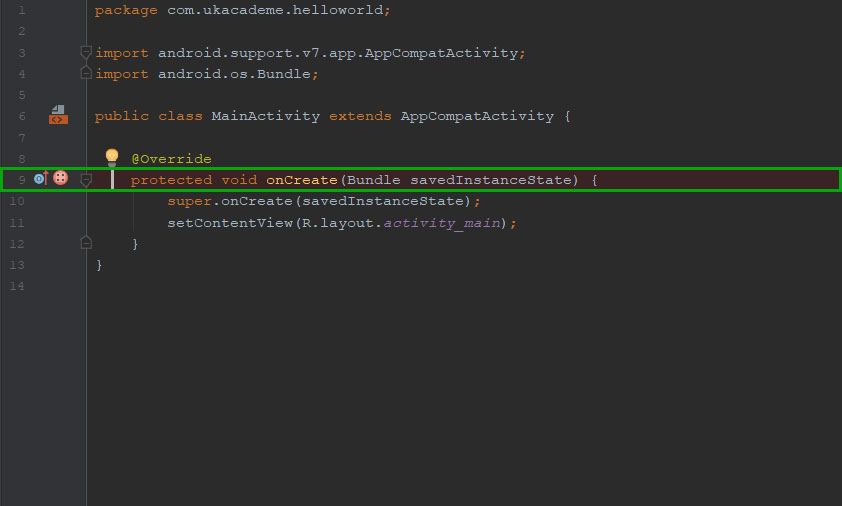
- Locate the line of code where you want to pause execution.
- Click in the left gutter of the editor window at that line, next to the line numbers. A red dot appears at that line, indicating a breakpoint.
You can also use Run > Toggle Line Breakpoint or Control-F8 to set a breakpoint at a line.
You don't have to update your app to add the breakpoint if it is already running.
Android Studio stops executing your application once your code has reached the breakpoint. Then you can use the tools in the Android deployment device to view the condition of the app and its debugging.
View and configure breakpoints
Click on a Breakpoint icon on the left side of the debugger window, to view all the breakpoints you set and configure the breakpoint settings. The Breakpoints window appears.
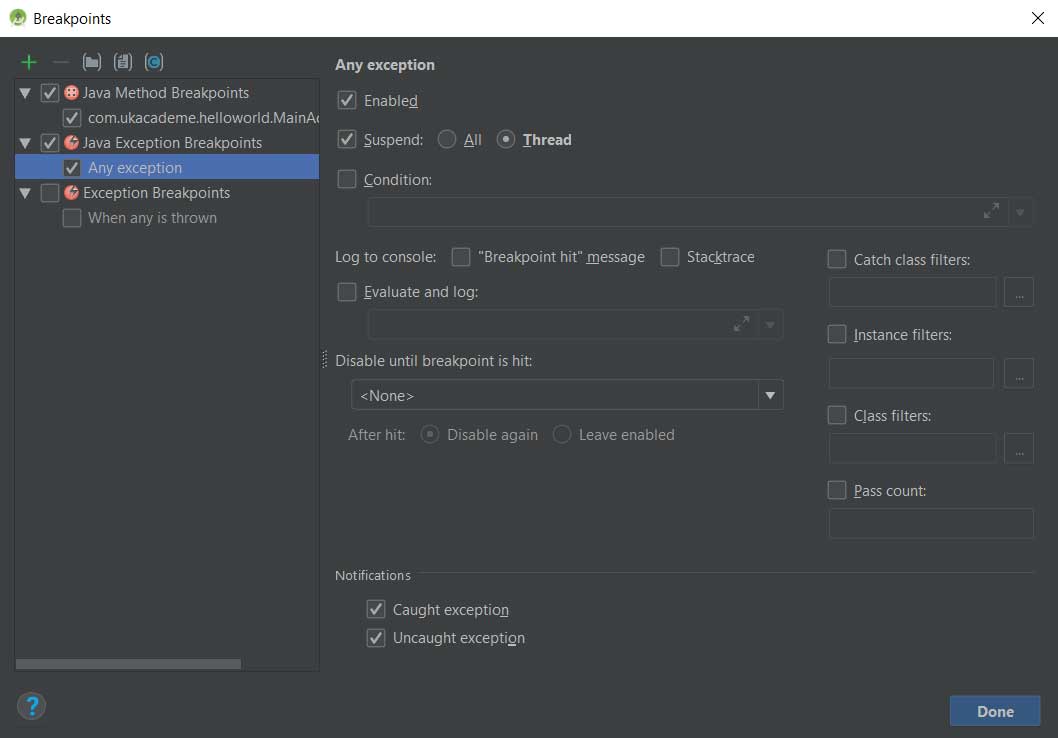
All interruptions you have set appear in this window on the left pane and each interruption can be activated or deactivated with the checkboxes. If a point of interruption is deactivated, Android Studio does not stop when your app reaches that point.
To configure its settings, select a breakpoint from the list. You can initially configure an interruption to be disabled and allow the system after another interruption is encountered. You can also determine if a breakpoint should be deactivated after it is reached.
Select Exception breakpoints from the list of breakpoints to determine a breakpoint for any exception.
Disable (Mute) all breakpoints
If you deactivate a breakpoint you can "mute" that breakpoint temporarily without removing it. If you remove a disconnect, you will lose any conditions or other features you have created for the disconnect.
Click the icon Mute Breakpoints Icon to silence all breakpoints. To enable all the breakpoints, click the icon again (unmute).